
Big Picture and Key Takeaway
1st Quarter 2025
(Click here for Printable PDF)
Key Takeaway
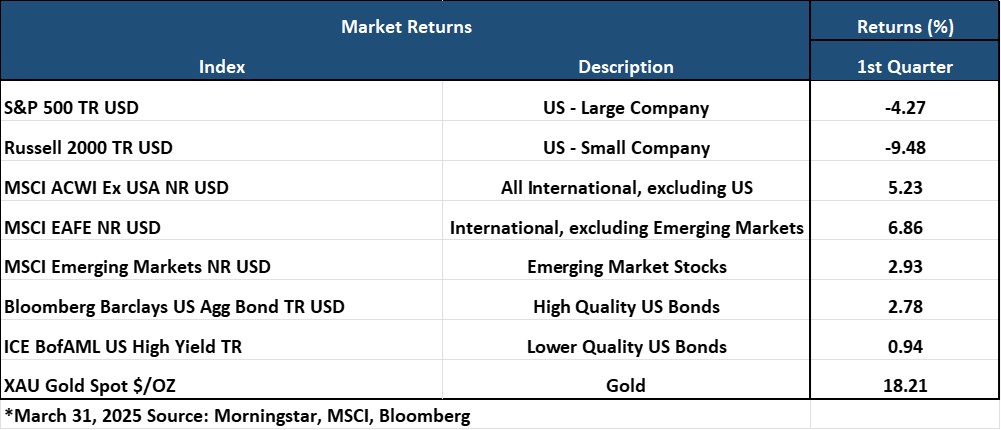
Global stock market performance diverged significantly in the 1st quarter. While US Large-cap stocks (S&P 500 -4.3%) and US Small-cap stocks (R2000 -9.5%) moved notably lower, both developed international stocks (MSCI EAFE +6.9%) and emerging market stocks (MSCI EM +2.9%) increased due to a weakening US dollar and a shift into cheaper assets abroad. The broad-based bond market also rose in the 1st quarter (AGG +2.8%) due to a decline in bond interest rates in a flight to safer assets in the face of potentially slower-than-expected US economic growth. Gold prices continued to benefit significantly from the increasing geopolitical and economic uncertainty. While the returns above reflect performance through March 31st, much has changed even since the end of the quarter.
On April 2nd, President Trump announced a comprehensive set of tariffs aiming to address perceived trade imbalances and protect domestic industries. The policy introduced a universal 10% tariff on all imported goods, with significantly higher rates for specific countries based on existing trade deficits and practices. The announcement triggered two of the worst single-day stock market selloffs since early 2020, with the S&P 500 down by over 10% on April 3rd through 4th. The roller coaster ride resumed with a 9.5% gain on April 9th, a daily gain that has not been seen since 2008, after a 90-day freeze was announced on the additional reciprocal tariffs for all countries except China. While it's too early to tell what economic policies and outcomes will ultimately emerge, even a minor whiff of Recession or “Stagflation” – a period of slow growth and high inflation – sent the stock market into a tailspin. The S&P 500 is now down around 10% in 2025. Downside risks to the economy are now likely increasing due to the following factors:
• Consumer & Corporate confidence is deteriorating
• The Negative impact of tariffs on earnings and GDP
• The Negative impact of retaliation from other countries (including less tourism into the US)
The central questions for investors are:
• First, will we see a recession, given the uncertainty that now exists for consumers and businesses alike?
• If so, how difficult will the recession be regarding depth and duration?
• Lastly, are we in a protracted bear market or just a steep short-term correction?
The stock market selloff seems to be pricing in a higher probability of recession than just weeks ago, and the future path of the stock market will be very dependent on the answers to the questions above. If we are in a bear market - defined by a 20% decline - and there is going to be a recession, the latter which is notoriously difficult to predict in advance, it means stocks may have further downside exposure as history suggests.
In these more difficult periods, we do believe that historical context is important. Since 1946, there have been 24 market “corrections” of -10%-20% for US stocks, with an average loss of 14%. There have been 14 “bear markets” where declines were greater than 20% and had an average loss of 32%. The most recent “bear market” occurred in 2022, before recovering sharply in 2023-24. “Recovering” is an important word because, generally, markets always do. It typically takes around 4-months to recover losses from “corrections,” on average. However, the recovery from “bear markets” averages around 2 years. It is yet to be determined what type of decline we may be experiencing since the situation is very fluid and policy can change quickly.
The silver lining for diversified investors so far this year is that diversification has helped mitigate losses. International stocks, high-quality bonds, real assets (commodities, infrastructure, real estate, and gold), and alternative investments have performed better than the US stock market before and after the tariff announcement. We will certainly follow developments carefully as they unfold and continually search for opportunities that we believe will be favorable to our clients' portfolios.
The Big Picture
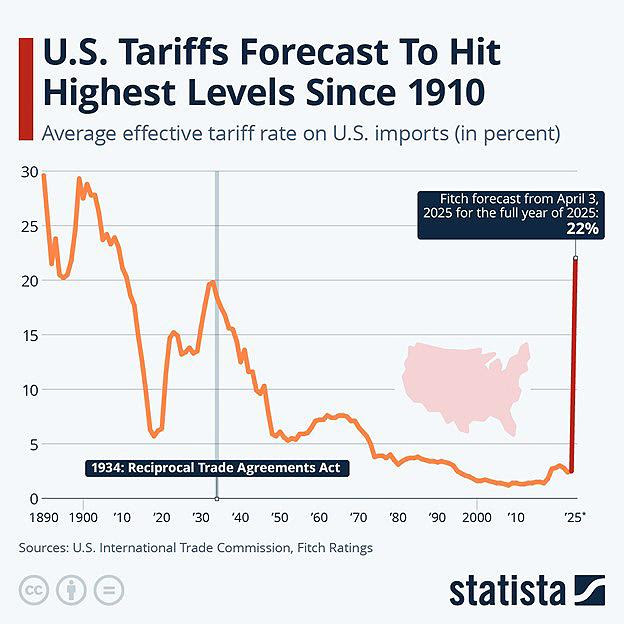
Prior to the tariff turmoil, the first quarter's economic data indicated a slowing of economic momentum as consumer and business sentiment soured, manufacturing readings turned lower, and short-term inflation expectations perked up. The loss of momentum was due to the anticipated trade policy, whereby tariffs if enacted, are set to reach levels not seen in over 100 years (see chart).
INFLATION: For March, the Bureau of Labor Statistics announced that the Consumer Price Index for All Urban Consumers (CPI-U) decreased by 0.1% from February on a seasonally adjusted basis. Core inflation (all items less food and energy) rose by 0.1% month-over-month. The year-over-year rates were 2.4% (CPI-U) and 2.8% (Core), from 2.8% and 3.1%, respectively, in February. Gas costs were a primary driver of the lower-than-expected headline reading. In general, the headline number (year-over-year) and the core results were lower than expected, which would have been received more positively if not for the concerns about tariffs on prices going forward.
GROWTH (Gross Domestic Product): Real gross domestic product (GDP) grew at an annual rate of 2.4% in the fourth quarter of 2024 according to the third estimate from the U.S. Bureau of Economic Analysis. The fourth-quarter increase was driven primarily by gains in consumer and government spending. This marks a slowdown from the 3.1% growth recorded in the third quarter. Looking ahead to the 1st quarter release, the Federal Reserve Bank of Atlanta's GDPNow forecasting model predicts an annualized growth decline of -0.3% adjusted for imports and exports of gold, where activity has been significant ahead of the tariffs.
JOBS: The March jobs report revealed that US employers added 228,000 jobs during the month, while the unemployment rate was 4.2% from 4.1% the previous month. The latest employment report was accompanied by modestly slowing wage growth, as wages increased by 3.8% year-over-year, less than expected and the slowest growth since July 2024. Despite continuing to moderate from a pace above 4%, the wage growth metric remains high relative to the overall inflation rate and is closely monitored by the Federal Reserve as a source of future inflationary pressure.
EARNINGS and ESTIMATES: As of April 4th, research firm FactSet reported that for Q1 2025, analysts have lowered the bottom-up EPS (earning per share) estimate for the S&P 500 by 4.2% (to $60.23 from $62.89) from December 31 to March 31. Analysts also lowered EPS estimates for the entire year of 2025 by 1.6% (to $269.67 from $274.12) during this same period. While analysts do typically reduce earnings estimates during a quarter, the decline in the Q1 bottom-up EPS estimate recorded during the first quarter was larger than the 5, 10, and 15-year averages – and this is before the impact of the April 2nd tariff announcement is considered.
RATES AND THE FED: In March, the Federal Reserve's Federal Open Market Committee opted to maintain the target range for the federal funds rate at 4.25% to 4.50%. This decision followed three consecutive rate cuts beginning in September 2024, which reduced the rate from a peak of 5.5%. The FOMC cited solid economic activity and a stabilized, low unemployment rate as key factors in their decision. However, they also noted that inflation remained somewhat elevated and acknowledged increased uncertainty surrounding the economic outlook. Fed Chair Jerome Powell spoke on April 4th after the tariff announcement, signaling concerns that the tariffs would reignite inflation at least temporarily while simultaneously hitting growth in a worst-case scenario of stagflation. Despite acknowledging these concerns, Powell stated the Fed would remain on the sidelines until it had more clarity. The Fed Funds Futures markets are now signaling approximately a 60% probability of four interest rate cuts for 2025.
Market Performance
Global Stocks
For the 1st quarter, 26 of the 37 developed markets tracked by MSCI were positive. And of the 46 developing markets tracked by MSCI, 40 were also positive. In the U.S., large companies outperformed small companies for the quarter, and value stocks beat growth stocks.
7 of the 11 S&P 500 sectors delivered a positive return.
The Energy sector performed best for the quarter, followed by Healthcare and Consumer Staples
The Consumer Cyclical and Tech sectors posted double-digit negative returns.
Developed and emerging market international stocks posted gains in the first quarter. The outperformance was attributed to a sharp decline in the U.S. dollar, a tailwind for international stock performance, and more attractive valuation levels.
China was a market winner for the quarter, along with Poland, the Czech Republic, Brazil, and Columbia. India, however, was down after a recent stretch of strong performance.
Bonds
The bond market posted a positive quarterly return as bond interest rates decreased significantly. The highlights include the following:
The 10-year Treasury bond yield decreased by 0.36% for the quarter, leading to a gain in U.S. Treasuries as the market priced in slower potential economic growth.
Treasury Inflation-Protected Securities increased and outperformed standard Treasuries as inflation expectations increased along with stubborn inflation data and the fear of the impact of tariffs on prices.
U.S. mortgage-backed securities outperformed most other fixed-income sectors as their high credit quality and attractive valuations compared to corporate bonds led to stronger price appreciation.
Credit spreads, a measure of the bond market's default risk, increased for the quarter. The highest credit quality bonds outperformed relative to lower credit quality bonds, the latter of which have higher income payments due to their inferior credit quality.
The Municipal market underperformed its taxable bond market counterparts, as yields on municipal bonds actually increased, as opposed to declining like equivalent-maturity Treasury Bonds.
Important Disclosure Information
This report is provided as information and commentary regarding the market. The views expressed in this report are as of the date of the report, and are subject to change based on market and other conditions. This report contains certain statements that may be deemed forward-looking statements. Please note that any such statements are not guarantees of any future performance and actual results or developments may differ materially from those projected.
Please note that nothing in this report post should be construed as an offer to sell or the solicitation of an offer to purchase an interest in any security or separate account. Nothing is intended to be, and you should not consider anything to be, investment, accounting, tax or legal advice. If you would like investment, accounting, tax or legal advice, you should consult with your own financial advisors, accountants, or attorneys regarding your individual circumstances and needs. Advice may only be provided by AtwoB after entering into an investment advisory or financial planning agreement. Moreover, you should not assume that any discussion or information contained in this newsletter serves as the receipt of, or as a substitute for, personalized investment and/or planning advice from AtwoB. If you are an AtwoB client, please remember to contact AtwoB, in writing, if there are any changes in your personal/financial situation or investment objectives for the purpose of reviewing/evaluating/revising our previous recommendations and/or services.
Past performance is not a guarantee of future returns. Investing involves risk and possible loss of principal capital. Different types of investments involve varying degrees of risk, and there can be no assurance that the future performance of any specific investment, investment strategy, or product (including the investments and/or investment strategies recommended or undertaken by AtwoB, or any non-investment related content, made reference to directly or indirectly in this newsletter will be profitable, equal any corresponding indicated historical performance level(s), be suitable for your portfolio or individual situation, or prove successful. Historical performance results for investment indices and/or categories have been provided for general comparison purposes only, and generally do not reflect the deduction of any fees or expenses, transaction and/or custodial charges, the deduction of an investment management fee, nor the impact of taxes, the incurrence of which would have the effect of decreasing historical performance results. It should not be assumed that your account holdings correspond directly to any comparative indices and/or categories.
AtwoB is neither a law firm nor a certified public accounting firm and no portion of the newsletter content should be construed as legal or accounting advice. A copy of the AtwoB's current written disclosure Brochure discussing our advisory services and fees continues to remain available upon request.
Index and Category Definitions
The S&P 500 Index is a capitalization-weighted index of 500 U.S. stocks. Russell 2000 TR USD is a market cap weighted index The Russell 2000 measuring the performance of approximately 2,000 smallest-cap American companies The MSCI All Country World ex-USA Index is a free float-adjusted market capitalization weighted index that is designed to measure the equity market performance of developed and emerging markets. The MSCI All Country World ex-USA Index consists of 22 developed and 24 emerging market country indices. The MSCI EAFE Index (Europe, Australasia, Far East) is a free float-adjusted market capitalization index that is designed to measure the equity market performance of developed markets, excluding the U.S. & Canada. The MSCI Emerging Markets (E.M.) Index is a free float-adjusted market capitalization index that is designed to measure equity market performance of 24 emerging markets countries. Bloomberg Barclays U.S. Aggregate Bond Index is an index of the U.S. investment-grade fixed-rate bond market, including both government and corporate bonds. ICE BofAML U.S. High Yield Index is an unmanaged index of below-investment grade U.S. corporate bonds. XZU Gold Spot $/Oz reflects the exchange rate of Gold against the U.S. dollar index.